
How to Map Better Marketing Choices with a Simple Decision Tree
Next month’s test budget lands on your desk. You could put it into paid social, support an influencer collaboration, or buy a placement in a partner newsletter. Everyone has an opinion, the meeting runs long, and the choice goes to whoever spoke last. Sound familiar?
There is a calmer way to make the call. Instead of debating the choice, draw it. A simple branching diagram helps you name your options, record what you expect from each one, and compare the tradeoffs. Below, you will frame a decision, sketch it on paper, check it with basic arithmetic, turn it into a shareable diagram, and apply the same logic to marketing automation.
Chapters
What a branching decision map is, in plain English
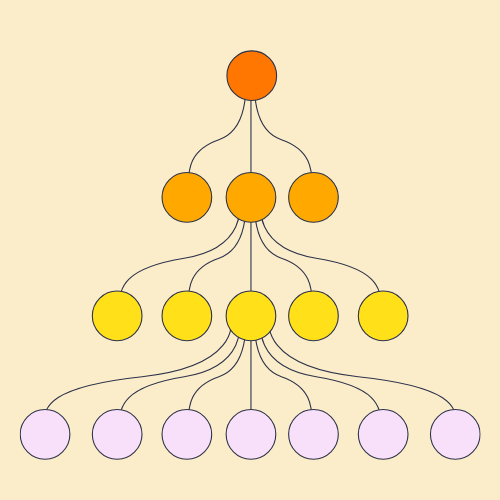
Atlassian describes a decision tree as an upside-down diagram of choices and outcomes, built from nodes, branches, and leaves. You start with one question, split it into options, and follow each option to a possible result.
Before you draw, frame the decision
Write the question and the success metric
Be specific. Instead of asking, “How should we grow?” ask, “Where should we spend the $6,000 test budget in March?” Then choose one metric that will settle the decision, such as qualified leads, pipeline value, revenue, or trial signups. Using several primary metrics makes branches harder to compare.
List two to four realistic options
Two options may be enough. Four is usually the limit before the diagram becomes difficult to follow. Next to each option, note one advantage and one drawback based on your own data, constraints, or past campaigns.
Sketch the first version by hand
Write the root question in a box at the top or on the left. Draw one branch for each option. Under every branch, add two or three realistic outcomes, such as meeting the target, underperforming, or stalling. Keep the first version shallow. Three options with two outcomes each are often enough to expose the main tradeoffs.
Make it decision-ready with light math
You can compare branches with a simple expected-value estimate. Multiply the chance of an outcome by its financial result, repeat for the other possible outcomes, and add the figures. Be consistent about whether you are comparing revenue, profit, leads, or another measure.
Suppose paid social has a 50 percent chance of producing $12,000 in revenue from a $4,000 spend, with no revenue in the unsuccessful case. Its estimated net value is $2,000: 50 percent of $12,000, minus the $4,000 spent. An influencer collaboration with a 30 percent chance of producing $20,000 from the same spend also has an estimated net value of $2,000.
The expected values are equal, but the risk is not. Paid social has the higher estimated chance of success, while the influencer branch depends on a less likely but larger result. The tree turns the discussion from personal preference into a clearer question about evidence and risk tolerance.
These figures are estimates, not forecasts. Test how the choice changes if a key assumption rises or falls. Then prune any branch that cannot affect the final call. Add a default path for unexpected outcomes because real campaigns rarely fit every assumption.
Turn your sketch into a clean, shareable diagram
If you want a ready-made template, a diagramming tool can help you build a cleaner version without manually positioning every shape. Lucidchart’s vendor pages describe shared comments, revision history, and data imports from sources such as Google Sheets, Excel, or CSV files. Those details can be useful when several people need to review assumptions or update values. Check current plan limits and pricing on the vendor’s site before choosing a tool.
Layout matters more than decoration. Keep labels short, use the same visual treatment for similar node types, and place the default path consistently. If the chart becomes tangled, Draw.io includes tree layouts that can automatically rearrange its shapes.
A worked example: picking a launch channel
Start with the root question: Which channel should launch the new plan in March, measured by trial signups?
Create three branches: paid social, influencer collaboration, and an email partner. Under paid social, add two outcomes. The campaign either meets the $40 cost-per-trial target or rises above $60. Based on the available budget, meeting the target could produce about 100 trials, while missing it could produce about 65. If you give each outcome a 50 percent chance, the estimate is roughly 83 trials. If you want a collaborative way to review the branch structure, a Tree diagram maker is one option to consider; Lucidchart’s vendor pages describe its templates, comments, and data-linking details.
Run the same rough calculation for the other two branches. Then summarize each option in one sentence: “The email partner is the steadiest, paid social offers the fastest feedback, and the influencer collaboration has the widest range of possible results.” The tree and those short summaries give decision-makers both the numbers and the practical tradeoffs.
Wire the logic into your automation
A decision map becomes more useful when it informs the next action. Most marketing automation platforms already use branching logic, so a simple tree can also serve as a plan for a nurture flow.
Dotdigital’s Decision node sends contacts down Yes and No paths based on set conditions. Salesforce Trailhead explains that Marketing Cloud Next uses a Decision element to split flows. The first matching rule wins, while a default path catches contacts who meet none of the earlier conditions. Rule order therefore matters. Put the narrowest or highest-priority condition first.
Two rules can cover a basic nurture flow. First ask, “Has this person opened something in the last seven days?” For contacts on the Yes path, ask, “Are they in a high-value segment?” Include a no-match path so every contact has a defined next step. Before activating the flow, test sample contacts that should enter each branch.
Common mistakes and quick fixes
- Too many branches: Limit the tree to two or three levels and use a default path for exceptions.
- No success metric: Define one primary measure before drawing the options.
- Unsupported assumptions: Label estimates and note where each figure came from.
- No validation: Run a small test, then update the tree with actual results.
- No review date: Decide when the assumptions and branches will be checked again.
A mini template you can copy
Paste this checklist into a document and complete it before your next planning meeting:
- Root question, written as one specific sentence
- Primary success metric
- Two to four realistic options
- Key assumptions behind each option
- Must-have constraints, such as budget or timing
- Two or three possible outcomes per option
- Default path for unplanned outcomes
- Decision owner and next action
- Next review date
If the tree points toward content rather than paid media, a set of reusable inbound marketing content templates can provide a starting structure for turning the channel decision into a publishing plan. Adapt any template to your audience, available resources, and chosen metric.
Tools worth a look
Draw.io is suited to people who want a lightweight diagramming option. Choose based on your team’s existing workflow, review needs, and budget rather than the longest feature list.
Draw small, decide, and ship
The goal is not a perfect diagram. It is a decision your team can understand, test, and explain later. Start with one question, two or three options, and a single metric. Make the choice, run the test, and update the tree when actual results challenge your assumptions. Ten minutes of structured drawing can prevent an hour of circular debate.
FAQ
Do I need probabilities to make this work?
No. Probabilities help compare branches with different risk levels, but rough estimates are enough for an initial tree. If you cannot support a percentage, label an outcome as likely, possible, or unlikely. The main value comes from making options and assumptions visible.
How is a decision tree different from a flowchart?
A flowchart maps a process from one step to the next. A decision tree maps choices and their possible outcomes, branching from a central question. Flowcharts explain how something runs, while decision trees help determine which option to choose and what might happen afterward.
How big should my tree be?
Keep it smaller than you first expect. Use two to four options at the root, two or three outcomes per branch, and no more than three levels. If a branch cannot change the final decision, remove or collapse it. A one-page tree is easier to review and update.
When should I update the tree?
Update it after a test produces new results, a budget changes, or a key assumption no longer holds. A quick review before the next planning cycle keeps the diagram useful without turning it into a long reporting exercise.
Other Interesting Articles
- AI LinkedIn Post Generator
- Gardening YouTube Video Idea Examples
- AI Agents for Gardening Companies
- Top AI Art Styles
- Pest Control YouTube Video Idea Examples
- Automotive Social Media Content Ideas
- Plumber YouTube Video Idea Examples
- AI Agents for Pest Control Companies
- Electrician YouTube Video Idea Examples
- How Pest Control Companies Can Get More Leads
- AI Google Ads for Home Services
- 60-Second Training Videos Are the New Corporate Standard
- Cybersecurity PR Pricing: Retainers, Deliverables & ROI
- Best AI Tools for Product Consistency in E-Commerce Video
Master the Art of Video Marketing
AI-Powered Tools to Ideate, Optimize, and Amplify!
- Spark Creativity: Unleash the most effective video ideas, scripts, and engaging hooks with our AI Generators.
- Optimize Instantly: Elevate your YouTube presence by optimizing video Titles, Descriptions, and Tags in seconds.
- Amplify Your Reach: Effortlessly craft social media, email, and ad copy to maximize your video’s impact.