
Best A/B Testing Tools for Smarter Marketing Experiments

A new headline can attract more clicks without generating more customers. A shorter form can increase submissions while reducing lead quality. A checkout change can look promising early and finish with no clear improvement.
A/B testing tools help you compare alternatives, but useful results depend on more than launching two versions of a page. You need a clear hypothesis, reliable measurement, enough relevant traffic, and a decision rule that matches your testing method.
Choose software around the experiments your team needs to run. Consider how it assigns visitors, tracks business outcomes, supports your website, and explains uncertainty. AI can help develop variations and organize ideas, while controlled experiments show how real visitors respond.
So, you’ve got an awesome website, but it feels like a hidden gem lost in the depths of the internet. You want to shout from the digital rooftops about your awesome content or products, but nobody seems to be listening. That’s where SEO swoops in like a caped crusader, ready to save the day.
But what exactly is SEO, and how can you harness its power to boost your online visibility?
Let’s demystify this whole SEO thing and break it down into bite-sized, understandable pieces.
Chapters
Best A/B Testing Tools You Need to Run Experiments
| Tool | Free plan | Cheapest paid plan | GDPR-ready | A/B testing built-in | Key takeaway |
|---|---|---|---|---|---|
| Matomo | Yes (On-Premise) | €19/mo (Cloud, 50K hits) | Yes (CNIL-approved) | Yes | Full data ownership with built-in heatmaps, session replays, and A/B tests at no extra cost |
| Personizely | No (14-day free trial) | $99/mo (50K visitors) | Yes | Yes | Shopify-focused A/B testing platform with theme, price and shipping tests, measured on revenue per visitor |
| Optimizely | No | Custom pricing | Yes | Yes | Enterprise experimentation platform for advanced targeting, feature testing and statistically rigorous web experiments |
| AB Tasty | No | Custom pricing | Yes | Yes | European experimentation suite combining A/B testing, personalization, feature flags and AI-assisted optimization |
| Mixpanel | Yes | Custom pricing | Yes | Yes | Event-driven product analytics with AI agents, session replay, and built-in experiments |
| VWO | Limited starter option | Paid plans available | Yes | Yes | Complete experimentation suite with visual testing, behavioral insights, personalization and server-side experiments |
| Amplitude Analytics | Yes (50K MTUs) | $49/mo (annual) | Yes | Yes (Experiments) | AI-powered product analytics designated Leader by Forrester, with 139 third-party integrations |
| Kameleoon | No | Custom pricing | Yes | Yes | AI-powered experimentation platform with web, full-stack and feature-flag testing for product and marketing teams |
Matomo
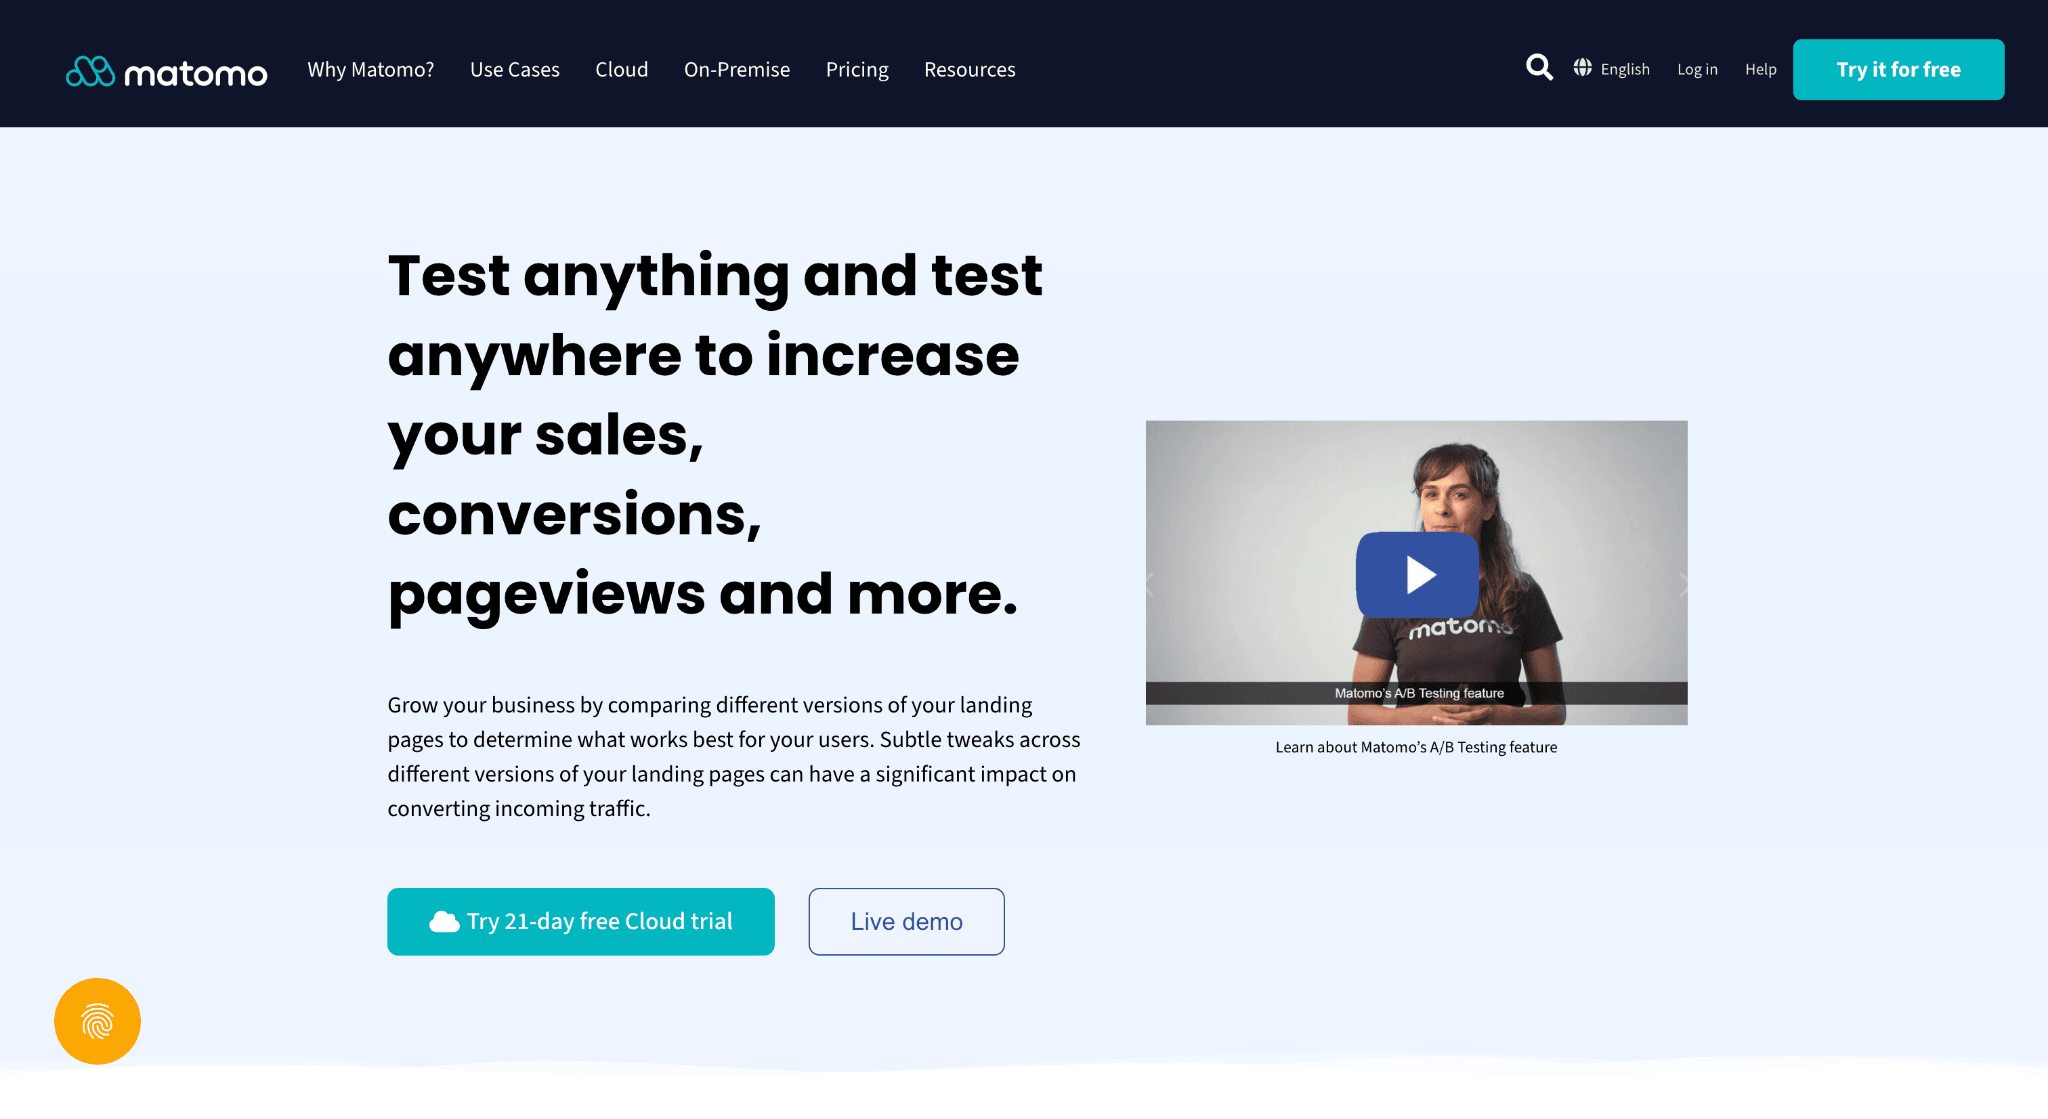
Matomo is one of the few analytics platforms that brings together web analytics, A/B testing, heatmaps and session recordings within the same ecosystem, giving teams a single privacy-first platform for experimentation and behavioral analysis. More than one million websites across 190-plus countries rely on it, and the CNIL has approved it as a tool that can collect data without a tracking consent banner.
In terms of pricing:
- Matomo Cloud starts at €19 per month for 50,000 hits, with data hosted in Germany.
- Matomo On-Premise is free forever: you download the open-source code, install it on your own servers, and keep full data ownership. That flexibility speaks to organizations bound by strict data-residency rules, or those that simply refuse to hand visitor data to a third party.
On A/B testing specifically, Matomo stands out by giving you complete ownership of your experimentation data. Unlike many third-party platforms, all test results remain under your control, making it a strong choice for organizations with strict privacy or compliance requirements. The platform is fully GDPR compliant, allowing you to optimize user experiences without sacrificing data protection.
For self-hosted (On-Premise) deployments, Matomo lets you run as many A/B tests as you want without usage limits, making it particularly attractive for teams that experiment continuously. The return on investment can be significant: even small improvements to landing pages, checkout flows, or sign-up forms can translate into substantial gains in conversions and revenue, all without increasing your acquisition budget.
Combined with Matomo’s privacy-first analytics, A/B Testing gives businesses a cost-effective way to identify friction points, validate design decisions with real user behavior, and maximize the value of their existing traffic.
Personizely
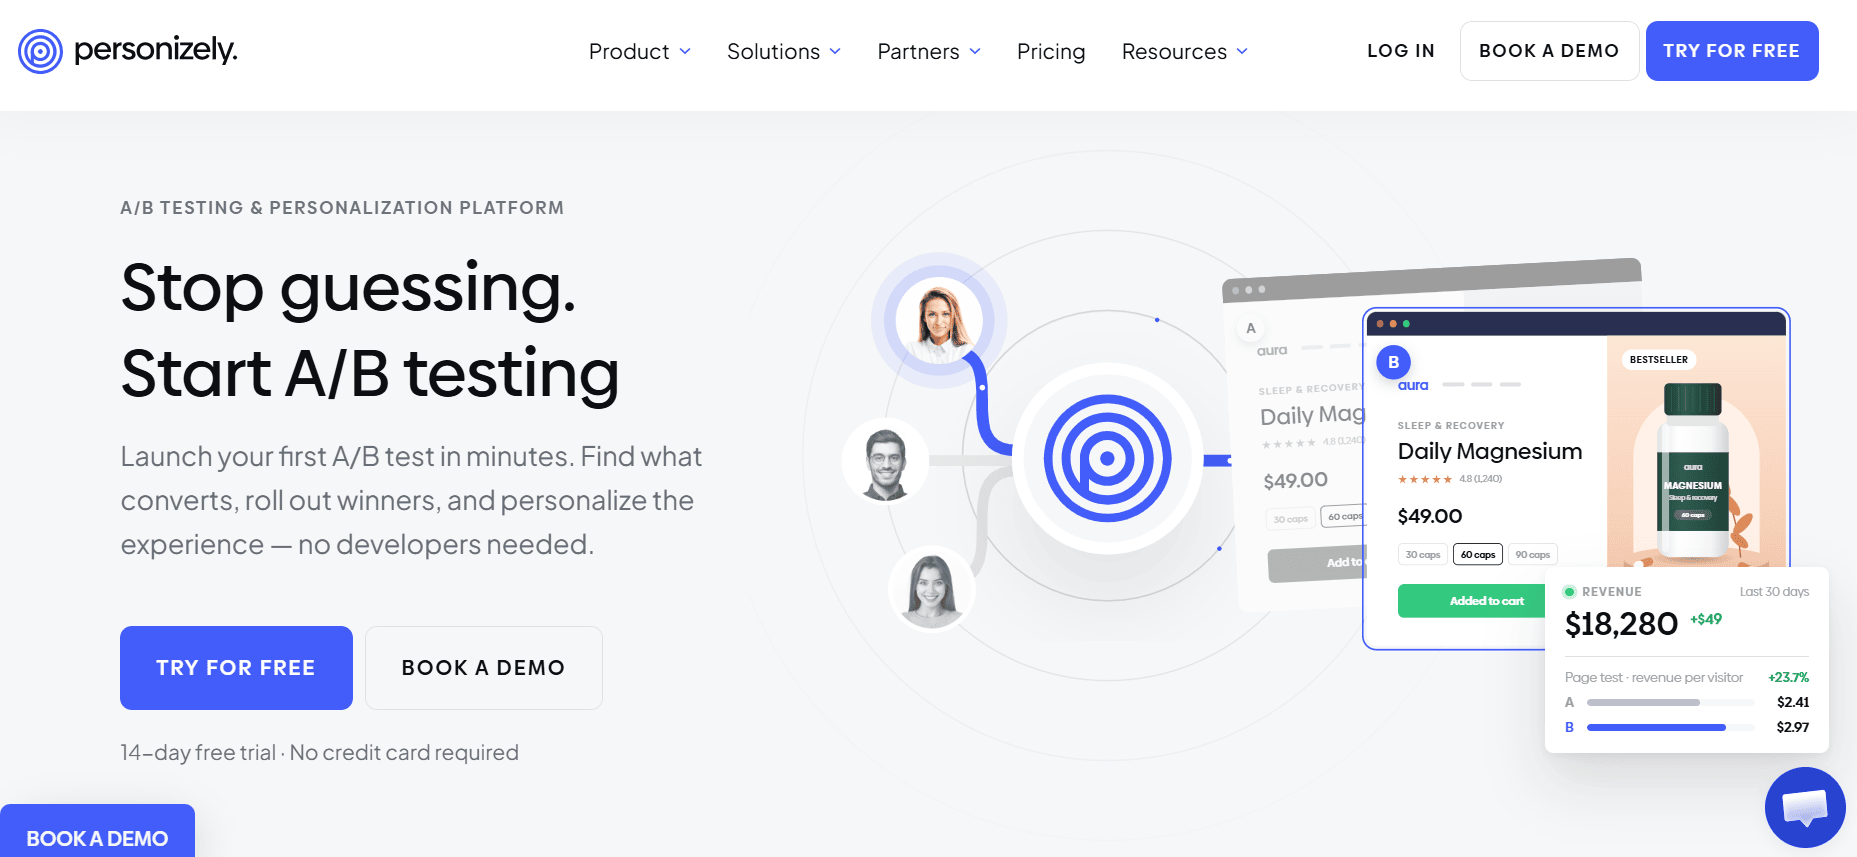
Personizely is an A/B testing platform for ecommerce brands, built for Shopify. Most tools on this list are designed for websites in general. Personizely is designed around the questions online stores actually ask: which product page, theme, price or shipping offer earns more revenue per visitor. It also runs on Wix, WooCommerce, BigCommerce, Webflow and any site where you can add a script.
The platform supports content tests with a visual editor, split URL tests, multipage and multivariate experiments, and custom code tests using JavaScript and CSS. On Shopify, it adds test types that few general-purpose tools offer: theme testing, price testing and shipping testing, including free-shipping thresholds.
Results are measured on revenue, not just clicks. Each variation shows conversion rate, revenue per visitor and average order value, and Shopify stores also get profit analytics. Teams can choose frequentist or Bayesian statistics and configure statistical parameters. Outlier detection keeps a few unusually large orders from skewing a result, and exclusion groups keep overlapping tests apart when several run at once.
Setup is light. On Shopify, Wix and WordPress, Personizely installs as an app or plugin; on other sites it takes one line of code. It loads a single script built with only the features a store uses, and anti-flicker protection keeps visitors from seeing the original version flash before a variant appears. Test results can also be sent to Google Analytics, Segment, Mixpanel or Microsoft Clarity.
Pricing is based on monthly visitors rather than orders or a share of revenue. The Essential plan costs $99 per month for up to 50,000 visitors and includes split URL and theme testing. Premium, at $149 per month, adds visual content testing, price and shipping testing, and advanced targeting. Both come with a 14-day free trial of every feature, no credit card required, and no annual contract.
The trade-off: theme, price and shipping testing are Shopify-only, and visual content testing sits on the Premium plan. For Shopify brands that want to test what actually drives revenue without an enterprise contract, it is one of the most focused options in the category.
Optimizely
Optimizely is one of the most established platforms dedicated to A/B testing and conversion experimentation. It is designed for organizations that run experiments continuously across websites, landing pages and customer journeys rather than treating testing as an occasional marketing exercise.
The visual editor lets teams create and modify page variants without rebuilding the original page. Marketers can test headlines, calls to action, layouts, navigation elements and complete user journeys, while developers can use custom code for more advanced experiments.
Audience targeting is one of Optimizely’s core strengths. Experiments can be restricted according to location, device, traffic source, browser, campaign parameters, visitor attributes and custom behavioral segments. This makes it possible to test different experiences for strategically important audiences rather than applying every experiment to all visitors.
The platform supports A/B tests, multivariate experiments and multi-page tests. Its statistical engine continuously evaluates performance while accounting for uncertainty, helping teams avoid declaring a winner too early based on temporary fluctuations.
Optimizely also integrates with analytics platforms, customer data platforms, content management systems and data warehouses. Experiment results can therefore be connected with revenue, retention and other business metrics rather than being limited to simple click-through rates.
The platform is primarily aimed at enterprise organizations. Pricing is available on request, and implementation generally requires more technical and organizational resources than lighter testing tools. For mature experimentation programs that need detailed targeting, governance and reliable statistical analysis, Optimizely remains one of the strongest options available.
AB Tasty
AB Tasty is a European experimentation and personalization platform built specifically for teams that want to improve digital experiences through continuous testing. Its toolkit covers websites, mobile experiences and product features, making it suitable for both marketing-led conversion optimization and product experimentation.
The visual editor allows non-technical users to create page variants by modifying text, images, layouts, buttons and other front-end elements. Developers can add custom JavaScript or CSS when experiments require deeper changes.
AB Tasty supports A/B tests, split URL tests, multivariate testing and multipage experiments. Teams can test isolated components or complete customer journeys, such as the progression from a landing page through product discovery and checkout.
Advanced targeting lets experiments run for specific audiences based on device, location, traffic source, browsing behavior, transaction history and custom attributes. Personalization campaigns can then use the same audience data to serve tailored experiences outside a formal experiment.
The platform also includes feature flags and server-side experimentation. Product and engineering teams can gradually release new functionality, compare variants and roll back changes without waiting for a complete deployment cycle.
Built-in reporting tracks conversion rates, revenue and custom goals. AB Tasty’s statistical engine helps determine whether observed differences are reliable, while integrations connect experiment data with analytics, customer data and marketing platforms.
Pricing is available on request and is better suited to mid-market and enterprise teams than occasional testers. For organizations looking for a genuine A/B testing specialist with strong European roots, AB Tasty is one of the most relevant platforms in the category.
Mixpanel
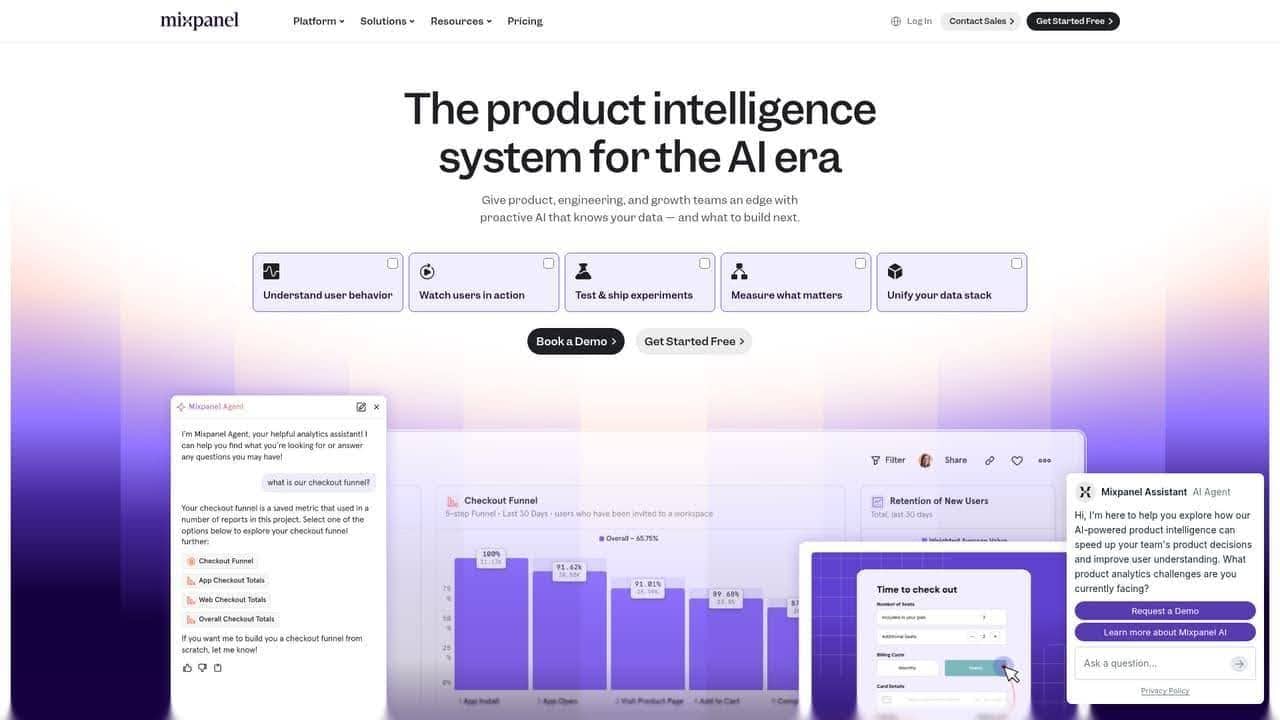
Mixpanel treats every user interaction as an event, building a behavioral data model that runs far deeper than pageview-based analytics. Its proprietary database, Arb, returns trend and funnel queries in seconds, even across millions of events. A free tier keeps the platform accessible, and paid plans scale into enterprise territory for organizations tracking complex product journeys.
A/B testing lives natively inside Mixpanel under the Experiments module. You design, launch, and analyze tests in the same environment where you already track product metrics, which spares you the context-switching that comes with a bolted-on experimentation tool. The Experiments Agent can even configure tests automatically from your goals, cutting setup friction.
Mixpanel AI brings in autonomous agents that watch product data continuously. Rather than waiting for someone to ask “what changed?”, the agents flag anomalies and surface insights proactively. Session Replay summarizes behavioral patterns with AI across hundreds of recordings, pairing quantitative data with visual context.
Audience segmentation supports cohort creation and custom buckets, so you can group users by behavior rather than demographics alone. Multi-touch attribution runs on a Last Touch default with a 30-day lookback window, though teams can adjust the model. Integration with over 100 tools, from CRMs and CDPs to data warehouses and ad platforms like Google Ads, means Mixpanel drops into existing stacks without a replatform.
GDPR and CCPA compliance are supported, with an optional European Data Residency program for teams that need processing inside the EU. Headless Mixpanel and MCP integration push the platform into code-driven workflows. According to a Forrester study, enterprise clients report a 354% average ROI with a six-month payback period.
One thing to plan for: Mixpanel’s event-based model rewards disciplined tracking implementation. Sloppy event taxonomies lead to messy data. The learning curve is manageable, helped along by Mixpanel University courses and a 12,000-member peer community.
VWO
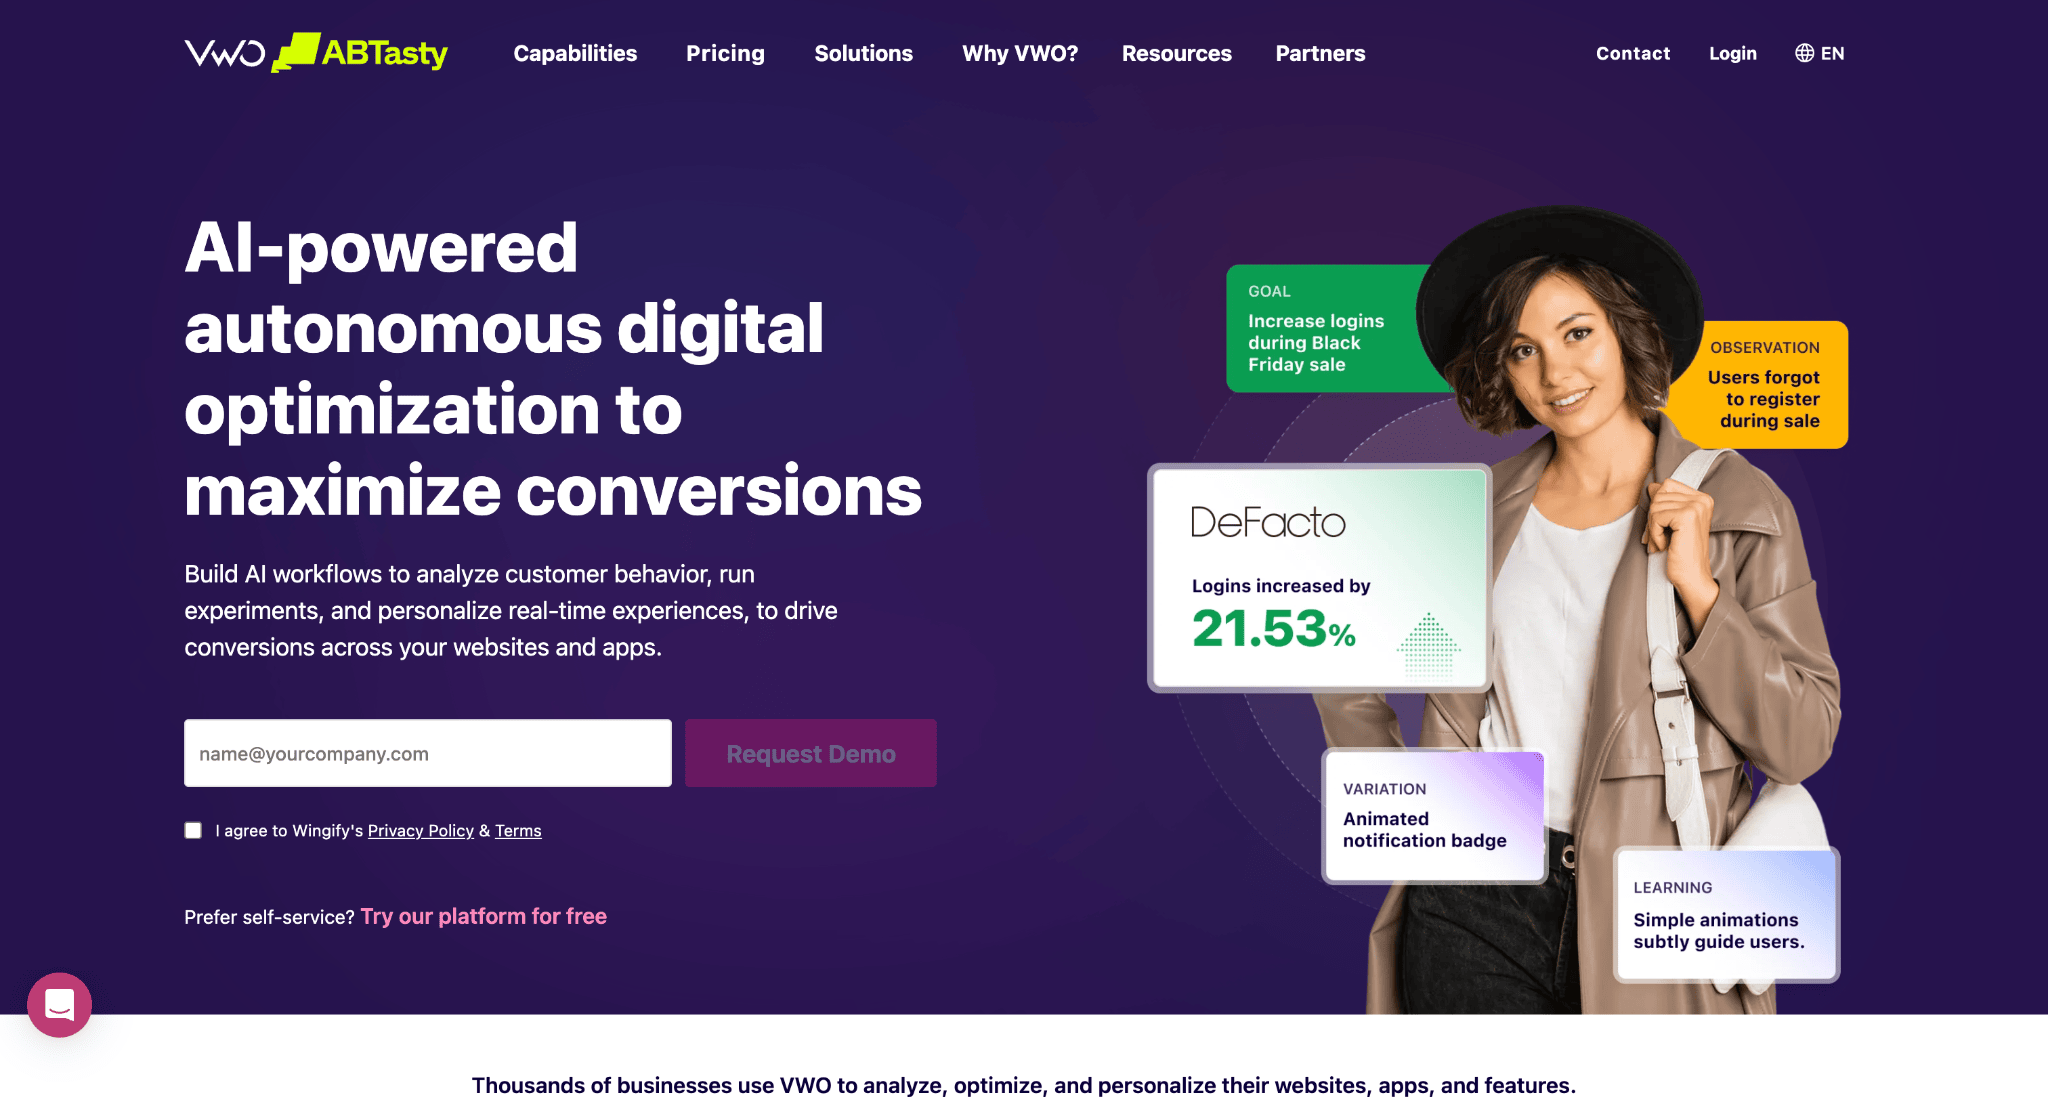
VWO is a dedicated experimentation platform that combines A/B testing with behavioral research, personalization and feature experimentation. It is designed to support the full optimization workflow, from identifying friction to launching a test and measuring its impact.
The visual editor lets marketers build page variants without changing the underlying website code. Text, images, forms, navigation elements and complete sections can be modified directly, while developers can use custom code for more complex experiments.
VWO supports A/B testing, split URL testing and multivariate experiments. Tests can target specific visitor segments according to device, location, campaign, traffic source, browser, behavior and custom audience attributes.
Behavioral features such as heatmaps, session recordings, form analytics and surveys help teams identify potential problems before creating an experiment. This removes the need to combine a separate behavioral analytics tool with the testing platform for basic hypothesis research.
The platform also supports server-side testing and feature rollouts. Product teams can test backend logic, pricing models, recommendation systems and new functionality without limiting experimentation to visible page elements.
Reporting includes conversion goals, revenue metrics, segmentation and statistical analysis. Guardrail metrics help teams verify that an experiment improves its primary objective without damaging other important indicators.
VWO can require more setup than lightweight visual testing tools, particularly when advanced segmentation or server-side experiments are involved. Its broader feature set, however, makes it a strong option for organizations that want research, experimentation and personalization within a single platform.
Amplitude Analytics
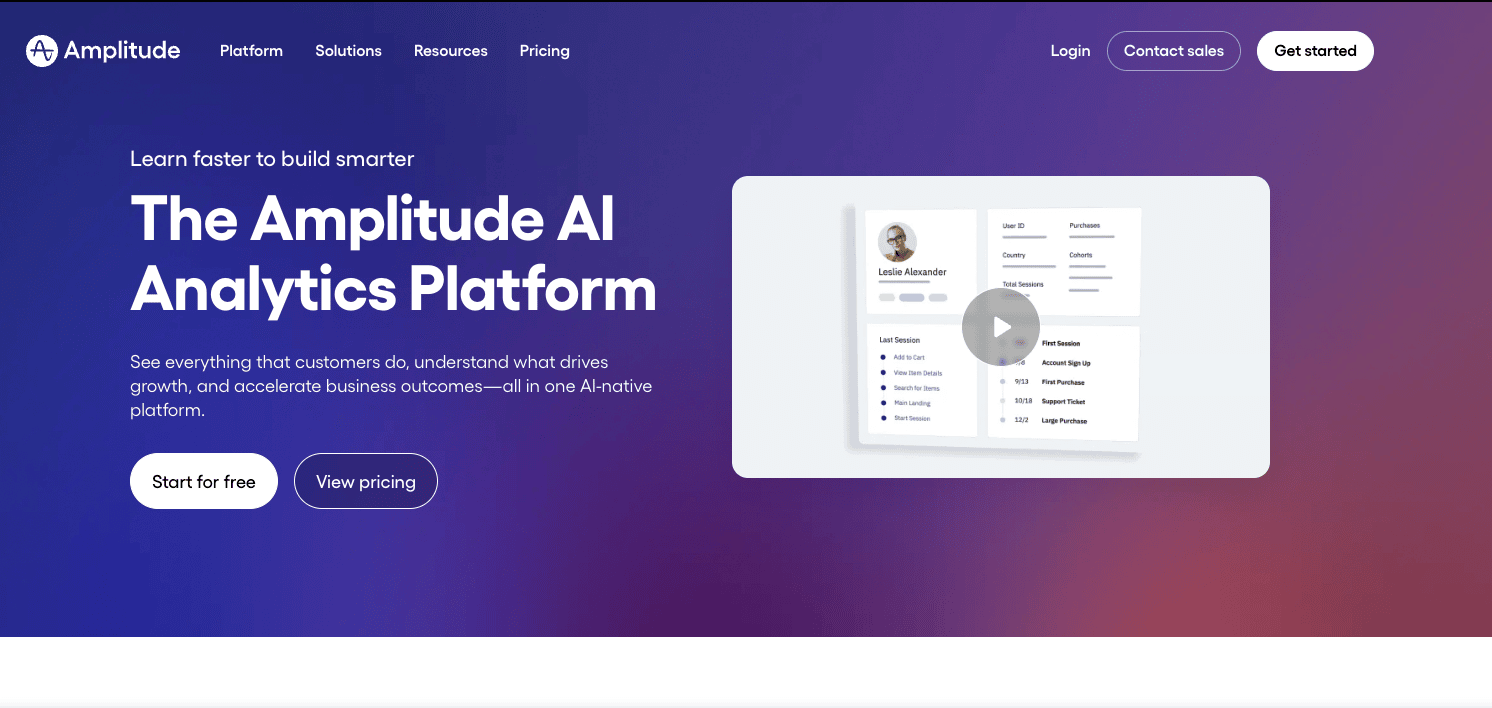
Amplitude bills itself as an AI-native analytics platform for product teams that need real-time behavioral insight. Forrester designated it a Leader in Q3 2025 across 21 evaluation criteria, putting it at the top of the product analytics category.
The free Starter plan tracks up to 50,000 monthly users with basic analysis features and starter templates. The Plus plan opens at $49 per month on annual billing, while Growth and Enterprise tiers carry custom pricing tied to data volume and support level.
AI agents run around the clock, catching anomalies and analyzing patterns before anyone on the team even asks. MCP integration with Claude and Cursor lets teams pull Amplitude insights straight into their AI workflows. Customer feedback analysis processes qualitative data alongside quantitative product metrics, bridging a gap that usually takes separate tools.
Compliance coverage spans GDPR, HIPAA, and CCPA, backed by SOC 2 Type 2, ISO 27001, ISO 27017, and ISO 27018 certifications. That stack of credentials matters for healthcare, fintech, and enterprise teams working under strict audit requirements.
The integration library reaches 139 third-party connectors, including CDPs like Tealium and Segment, data warehouses like BigQuery and Amazon Redshift, and marketing automation platforms. Retention analysis charts and adaptive dashboards give product managers a real-time read on user engagement trends without writing SQL.
Here’s the limitation: Amplitude stores data exclusively on its own cloud servers. Teams that need on-premise hosting for regulatory reasons will have to look elsewhere. The platform’s depth also brings a learning curve that lighter tools sidestep, so budget onboarding time for non-technical members.
Kameleoon
Kameleoon is an experimentation platform built for organizations that want to run A/B tests across both marketing websites and digital products. It combines visual experimentation, server-side testing, feature flags and AI-powered personalization in a single platform, making it suitable for marketing, product and engineering teams alike.
The visual editor allows marketers to build page variations without relying on developers for every change. Headlines, layouts, calls to action, forms and navigation elements can all be tested directly from the interface, while developers can use SDKs and APIs for more advanced experiments.
Kameleoon supports classic A/B tests, multivariate testing, split URL experiments and full-stack experimentation. Feature flags enable progressive rollouts, controlled releases and rapid rollback if a new feature negatively impacts user behavior or business metrics.
Advanced audience targeting lets teams segment visitors based on device, location, traffic source, customer attributes, browsing behavior or CRM data. AI-powered predictive targeting can automatically identify visitors who are most likely to respond positively to a specific variation, helping maximize experiment impact.
The reporting suite tracks conversion rates, revenue, engagement and custom business goals while providing statistical significance calculations and detailed audience segmentation. Integrations with analytics platforms, CDPs, CMSs and data warehouses make it easy to incorporate experimentation data into existing reporting workflows.
Kameleoon is primarily designed for mid-market and enterprise organizations with mature experimentation programs. While implementation is more involved than lightweight visual testing tools, it offers one of the most comprehensive experimentation platforms for teams looking to combine web testing, feature experimentation and personalization under a single solution.
Check Experiment Data Quality Before Choosing a Winner
Before interpreting a conversion increase, check whether the experiment measured the intended audience correctly.
A polished report can still contain missing events, inconsistent visitor assignments, or duplicate purchases. These problems can make an ineffective variation appear successful.
Compare Expected and Actual Traffic Allocation
If an experiment assigns visitors equally, the observed groups will rarely be exactly equal. Small differences are normal.
A statistically unexpected difference between the planned and observed allocation is called a sample ratio mismatch. It can indicate problems with assignment, tracking, eligibility rules, or how visitors enter the analysis.
Microsoft’s experimentation team advises investigating the cause before trusting the outcome of an experiment with this issue. A statistical check matters because the significance of an imbalance depends on sample size. Source: Microsoft Research on sample ratio mismatch
Test the Measurement Alongside the Experience
Before launch, verify that:
- Eligible visitors receive the intended experience.
- Returning visitors keep their assignment where the design requires it.
- Both versions record the same conversion event.
- Purchases or submissions are not counted twice.
- Mobile and desktop journeys work correctly.
- Redirects and cross-domain steps preserve the required identifiers.
- Internal traffic is handled consistently.
An A/A test, where both groups receive the same experience, can help diagnose assignment and measurement problems. It does not certify that every future experiment will be valid.
Separate Safety Monitoring From Winner Selection
Monitor broken forms, payment errors, and severe performance problems throughout the test. You should be able to stop a harmful variation without waiting for a marketing conclusion.
However, repeatedly checking ordinary fixed-horizon significance results and stopping at the first favorable result can increase false positives. Continuous decision-making requires a statistical method designed for repeated analysis. Source: Microsoft Research on monitoring experiments
Match the Experiment to Your Traffic and Buying Cycle

There is no universal minimum visitor count or test duration that works for every website.
The required sample depends on your baseline performance, the effect you want to detect, your analysis method, and the uncertainty you are willing to accept.
Define the Smallest Improvement Worth Detecting
The minimum detectable effect, or MDE, is the effect size used to plan a test’s statistical power. Choose it in relation to a commercially meaningful change, then check whether your traffic makes that test feasible.
Suppose your baseline conversion rate is 4%. Detecting an increase to 4.4% means looking for:
A 0.4 percentage-point absolute increase.
A 10% relative increase.
Those figures describe the same change. Confusing them can lead to unrealistic expectations.
Smaller effects generally require larger samples under otherwise comparable assumptions. Microsoft’s experimentation guidance emphasizes sample size and statistical power when planning reliable tests.
Count Eligible Traffic
Total website traffic is rarely the right planning number.
If the experiment applies only to visitors reaching a particular checkout step, use traffic to that step. If it targets signed-in customers in one region, plan around that eligible audience.
Avoid dividing limited traffic among many variations. One control and one well-developed alternative may be more practical than testing several minor wording changes.
Allow Outcomes Time to Develop
A visitor may click today, request a demo tomorrow, and become a qualified opportunity later.
Define the conversion observation window before launch. Give participants sufficient follow-up time rather than comparing fully observed early visitors with recent visitors whose outcomes are still developing.
Research from Spotify’s engineering team explains how repeated observations and incomplete outcome windows can complicate sequential analysis.
Adapt When Traffic Is Limited
If the planned experiment would take too long:
- Test a substantial change tied to a clear customer problem.
- Reduce the number of variants.
- Focus on a higher-traffic journey where the hypothesis still applies.
- Use interviews and usability sessions to improve the proposal first.
- Accept that the experiment may remain inconclusive.
Qualitative research can explain confusion and uncover opportunities. It does not provide the same causal evidence as a properly designed randomized test.
Use AI to Build Distinct Test Variations
AI can accelerate research summaries, hypothesis development, and copy drafting. Its value depends on giving it a specific problem to address.
Generating ten versions of the same vague headline creates options without necessarily creating a useful experiment.
Start With Evidence and a Hypothesis
Use observations such as:
- Visitors repeatedly ask what a plan includes.
- Shoppers struggle to find delivery information.
- Prospects misunderstand who a service is for.
- Users abandon a form after encountering an unclear field.
Turn the observation into a testable explanation:
“Visitors hesitate because they do not understand what happens after requesting a demo. Explaining the next step beside the form will increase completed requests without reducing lead quality.”
That hypothesis gives AI a focused drafting task.
Generate Variations Around One Reason for Change
A practical prompt is:
Create three copy options for a demo request page. The hypothesis is that visitors hesitate because the next step is unclear. Use only the approved facts below. Explain what happens after submission without changing the offer, inventing promises, or adding urgency. For each option, explain how the wording addresses the hypothesis.
Choose the strongest candidate for the experiment. Review its accuracy, tone, accessibility, and consistency with the actual experience.
Keep the Treatment Stable During Measurement
For a conventional copy test, approve the variation before launch and keep it stable.
If AI continuously changes the content, you are testing an adaptive content system rather than one fixed headline. That can be a valid experiment, but the treatment, logging, and analysis need to reflect it.
Record the content, prompt, and relevant configuration so your team can understand what visitors received.
Use AI to Explain Results Carefully
AI can help summarize an experiment report, but provide verified calculations and clearly defined metrics.
Ask it to distinguish:
- Observed results.
- Statistical uncertainty.
- Possible explanations.
- Questions requiring another experiment.
Do not treat AI’s preferred wording or prediction of a “winning” variation as evidence of customer response.
Protect Search Visibility During Website Experiments
Website experiments can change page content, URLs, and redirects. Plan how search engines will encounter those changes.
Google provides specific guidance for minimizing the search impact of A/B tests.
| Testing situation | Recommended practice | Purpose |
|---|---|---|
| Variants use separate URLs | Use canonical links from alternate test URLs to the original URL | Indicate the preferred URL for closely related test versions |
| Visitors are redirected to a variant | Use a temporary 302 redirect | Signal that the experimental redirect is temporary |
| Content differs between versions | Avoid deliberately serving search crawlers a separate experience unavailable to users | Prevent cloaking |
| The experiment has ended | Implement the chosen experience and remove obsolete testing elements promptly | Retire temporary URLs, scripts, and markup |
Google recommends canonical links rather than using noindex as the default way to handle alternate test URLs. Its guidance also says to run experiments only as long as necessary. Source: Google’s website testing recommendations
Also check whether your experiment introduces visible content flicker, layout movement, or loading delays. Those effects become part of the experience you are testing.
A visitor-level conversion experiment does not establish that a variation improves organic rankings. If your goal is SEO performance, define an appropriate search-focused experimental design and measurement approach.
Turn A/B Test Results Into Business Decisions
A test is useful when it leads to a defensible decision: adopt the change, reject it, or gather more evidence.
Use the StoryLab.ai Experiment Decision Framework:
Hypothesis → Primary Outcome → Guardrails → Evidence → Decision
Hypothesis
Describe the customer problem, proposed change, and expected effect.
Keep this specific enough that an unsuccessful result still teaches you something.
Primary Outcome
Choose the main success measure before launch.
A demo-page experiment might prioritize qualified demo requests. An ecommerce experiment might prioritize purchases or revenue per eligible visitor.
Clicks can help explain behavior, but they may be too far from the business objective to determine success alone.
Guardrails
Choose measures that should not deteriorate beyond an agreed level.
| Experiment | Possible primary outcome | Useful guardrail |
|---|---|---|
| Shorter lead form | Qualified leads per eligible visitor | Spam submissions and sales acceptance rate |
| New product page layout | Purchases per eligible visitor | Returns, cancellations, and page performance |
| Discount presentation | Contribution margin per eligible visitor | Refunds and support complaints |
| Subscription onboarding | Activation rate | Early cancellations and support requests |
Evidence
Review data quality, effect size, uncertainty, and business relevance together.
An observed increase from 4% to 4.4% is a 10% relative lift. That calculation alone says nothing about statistical reliability or whether the benefit exceeds implementation costs.
Treat unexpected segment findings as exploratory unless your analysis plan supports stronger conclusions. Searching many segments for a winner increases the chance of finding a misleading result.
Decision
Use clear outcome labels:
- Adopt: Evidence supports a worthwhile improvement and acceptable guardrails.
- Reject: The change causes harm or fails the agreed decision criteria.
- Inconclusive: The evidence cannot reliably distinguish the outcomes that matter.
“Inconclusive” does not mean the versions are identical. It means the experiment has not resolved the decision.
Save the hypothesis, audience, screenshots, measurement definitions, result, and decision rationale. This record helps your next experiment build on what you learned rather than repeat the same uncertainty.
FAQ
What makes an A/B testing tool different from a standard analytics platform?
A standard analytics platform reports what happened: pageviews, bounce rates, traffic sources. An A/B testing tool adds a controlled experiment layer, splitting traffic between variants and applying statistical analysis to decide which version performs better.
Some platforms bundle both. Others focus purely on experimentation or analytics, so you combine two tools. Your choice comes down to whether the priority is understanding behavior or actively testing changes.
How much traffic do you need before A/B testing produces reliable results?
Statistical significance needs enough conversions per variant to rule out random chance. Most practitioners cite a minimum of several hundred conversions per variation, though the exact threshold hinges on your baseline conversion rate and the size of the expected lift.
Low-traffic sites can still test by extending the test duration or focusing on high-impact pages. When your sample size grows slowly, patience matters more than volume.
Can privacy-focused tools still run meaningful experiments?
Yes. Matomo and Piwik PRO prove that GDPR compliance and experimentation coexist. Cookie-free tracking methods, IP anonymization, and consent management handle regulatory duties without crippling data quality.
The trade-off is that some privacy-first tools limit cross-device tracking or long-term user identification. Design experiments around session-level metrics when persistent identifiers aren’t available, and you can still draw actionable conclusions.
Should you pick a free tool or invest in a paid platform?
Free plans from platforms like Matomo, Mixpanel or Amplitude are often enough to start experimenting and validating hypotheses. They typically limit traffic, advanced experimentation features or support. Paid platforms become worthwhile once A/B testing becomes a continuous optimization process rather than an occasional exercise.
Think about your testing cadence. One test per quarter might not warrant a premium subscription. Teams shipping multiple experiments a month recover the investment quickly through compounding conversion gains.
How do you evaluate whether an A/B testing tool fits your tech stack?
Start with integration compatibility. Check whether the tool connects to your CMS, data warehouse, CDP, and ad platforms without custom middleware. Native integrations cut implementation time and ongoing maintenance.
Then weigh data portability. Tools with API access, raw data export, or warehouse-native connectors shield you from vendor lock-in. When switching costs run high, you’ll hesitate to move even after a better option shows up.
Other Interesting Articles
- AI LinkedIn Post Generator
- Gardening YouTube Video Idea Examples
- AI Agents for Gardening Companies
- Top AI Art Styles
- Pest Control YouTube Video Idea Examples
- Automotive Social Media Content Ideas
- Plumber YouTube Video Idea Examples
- AI Agents for Pest Control Companies
- Electrician YouTube Video Idea Examples
- How Pest Control Companies Can Get More Leads
- AI Google Ads for Home Services
- 60-Second Training Videos Are the New Corporate Standard
- Cybersecurity PR Pricing: Retainers, Deliverables & ROI
- Best AI Tools for Product Consistency in E-Commerce Video
Master the Art of Video Marketing
AI-Powered Tools to Ideate, Optimize, and Amplify!
- Spark Creativity: Unleash the most effective video ideas, scripts, and engaging hooks with our AI Generators.
- Optimize Instantly: Elevate your YouTube presence by optimizing video Titles, Descriptions, and Tags in seconds.
- Amplify Your Reach: Effortlessly craft social media, email, and ad copy to maximize your video’s impact.